Add analysis
Lotka Volterra model
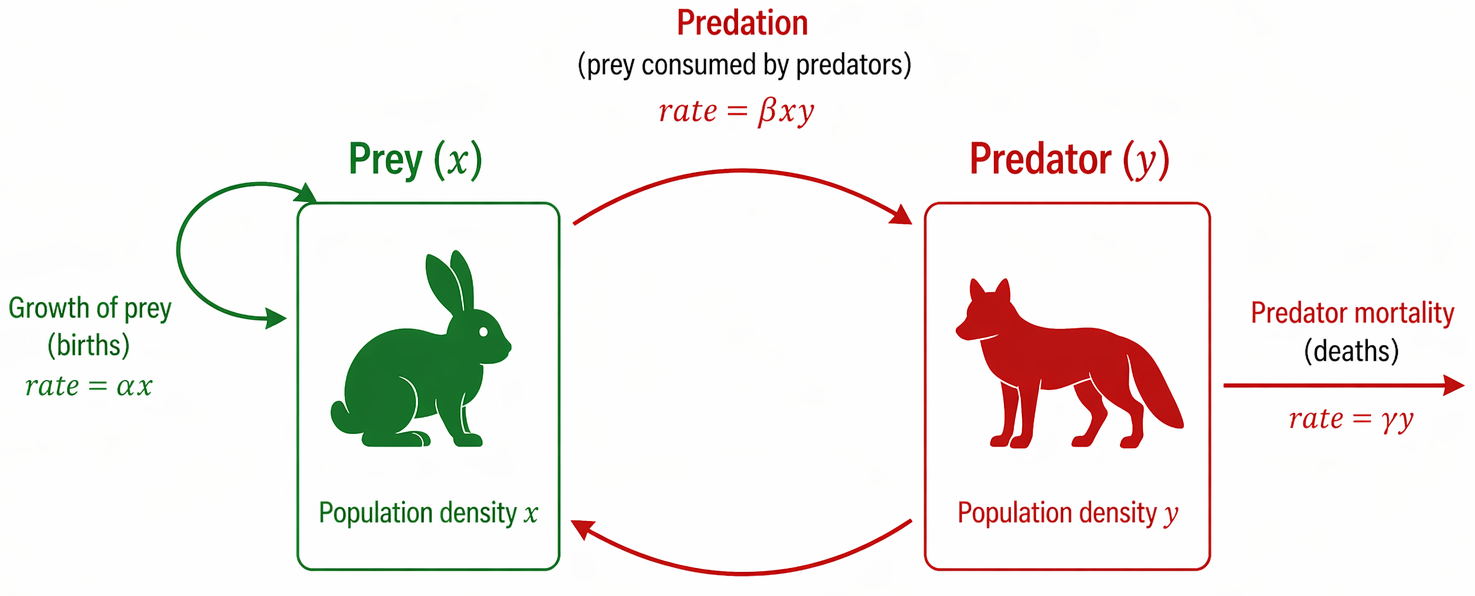
The Lotka-Volterra equations, developed in the 1920s by Alfred Lotka and Vito Volterra representing the cyclic, phase-shifted population dynamics between a predator and its prey.
tune
Simulation parameters
tune
Initial conditions
analytics
Analyses
Short Simulation
Loading chart...
Extended Simulation
Loading chart...
Model Details
Review and edit model structure, biological variables, and kinetic parameters.
| Name | Tex name | Initial value | Actions |
|---|---|---|---|
Edit Options
Edit Options
preview
Generated Python Code
import numpy as np

def model(
    time: float,
    variables: list[float],
):
    Prey, Predator = variables
    Alpha = 0.1
    Beta = 0.02
    Gamma = 0.4
    Delta = 0.02
    prey_growth = Alpha * Prey
    predation = Predator * Prey
    predator_death = Gamma * Predator
    dPreydt = +prey_growth+(- Beta)*predation
    dPredatordt = +(Delta)*predation-predator_death
    return [dPreydt, dPredatordt]

def all_derived(
    time: float,
    variables: list[float],
):
    Prey, Predator = variables
    Alpha = 0.1
    Beta = 0.02
    Gamma = 0.4
    Delta = 0.02
    prey_growth = Alpha * Prey
    predation = Predator * Prey
    predator_death = Gamma * Predator
    return [prey_growth, predation, predator_death]

derived = all_derived
y0 = {"Prey": 10, "Predator": 10}
preview
Generated LaTeX Code
\begin{align*}
      \frac{d Prey}{dt} &= \alpha \cdot Prey - \beta \cdot Predator \cdot Prey\\
\frac{d Predator}{dt} &= \delta \cdot Predator \cdot Prey - \gamma \cdot Predator
    \end{align*}
Edit analysis
Plot options
Variable selection
Show Normalize
Edit analysis
Plot options
Variable selection
Show Normalize