Ebenhöh 2014, Philos Trans.
The Ebenhöh 2014 model is a kinetic model of the photosynthetic electron transport chain (PETC), built to study how a photosynthetic organism acclimates to changing light on short timescales. It comprises seven coupled ordinary differential equations and represents the main components of the PETC — photosystem II (PSII), the plastoquinone pool, the cytochrome b6f complex, plastocyanin, photosystem I (PSI), ferredoxin, ferredoxin-NADP+ reductase and the ATP synthase — together with both linear and cyclic electron flow. PSII is described under a quasi-steady-state assumption using a four-state reaction-center model. In addition, the model captures the relocation of light-harvesting complexes between PSII and PSI (state transitions), thereby changing the antenna cross sections of the two photosystems.
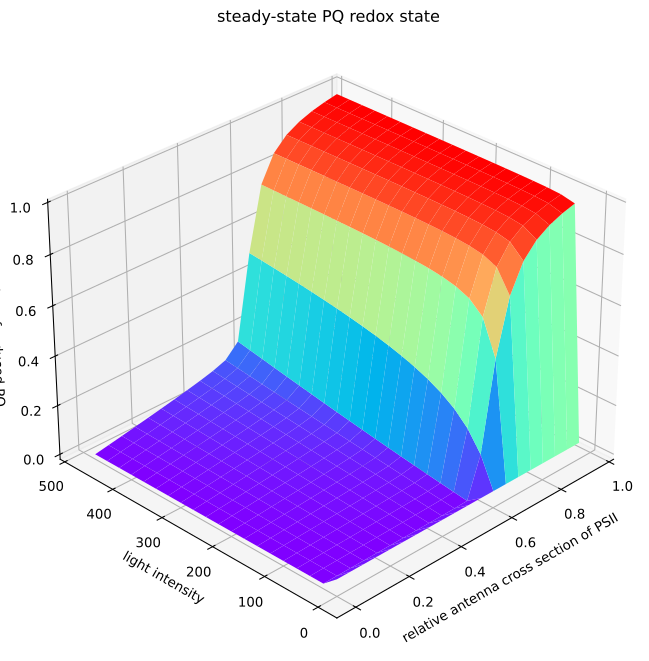
Because the model was developed to describe short-term acclimation of the PETC to different light regimes, it was validated against PAM fluorescence data from Chlamydomonas reinhardtii, showing both light-induced and anoxia-induced state transitions. The light-induced state transition reported in the publication is reproduced exactly by this implementation; the anoxia-induced state transition and figure 3, however, show some discrepancies from the original publication while still agreeing with the overall dynamics. Beyond serving as a base model for short-term PETC acclimation, it provided the foundation for Matuszynska 2016 and Matuszynska 2019. For that reason, it is included in GreenSloth as a starting point for understanding how the light reactions of photosynthesis are modeled.
Analysis
Model definition
Variables
| Symbol | ID | Initial value |
|---|---|---|
| Plastoquinone_oxidised | 17.5 | |
| Plastocyanine_oxidised | 0.0202 | |
| Ferredoxine_oxidised | 5 | |
| ATP | 0 | |
| NADPH | 0 | |
| protons_lumen | 0.00025238293779207717 | |
| Light_minus_harvesting_complex | 0.9 |
Parameters
| Symbol | ID | Value |
|---|---|---|
| pH | 7.8 | |
| PPFD | 100 | |
| cPPFD | 0.3333333333333333 | |
| PSII_total | 2.5 | |
| PSI_total | 2.5 | |
| PQ_tot | 17.5 | |
| PC_tot | 4 | |
| Fd_star | 5 | |
| NADP_star | 25 | |
| A_star_P | 60 | |
| LHC_tot | 1 | |
| F | 96.485 | |
| R | 0.0083 | |
| T | 298 | |
| bH | 100 | |
| E0_QA | -0.14 | |
| E0_PQ | 0.354 | |
| E0_PC | 0.38 | |
| E0_P700 | 0.48 | |
| E0_FA | -0.55 | |
| E0_Fd | -0.43 | |
| E0_NADP | -0.113 | |
| kH0 | 500000000 | |
| kH | 0 | |
| kF | 62500000 | |
| k2 | 1200000000 | |
| Q | 0 | |
| staticAntI | 0.2 | |
| staticAntII | 0 | |
| kf_atp_synthase | 20 | |
| kf_atp_consumption | 10 | |
| Pi_mol | 0.01 | |
| DeltaG0_ATP | 30.6 | |
| HPR | 4.666666666666667 | |
| kf_nadph_consumption | 15 | |
| kf_proton_leak | 0.01 | |
| kPQred | 250 | |
| kcat_b6f | 2.5 | |
| kPTOX | 0.01 | |
| kPCox | 2500 | |
| kFdred | 250000 | |
| kcat_fnr | 500 | |
| E0_fnr | 3 | |
| km_fnr_Ferredoxine_reduced | 1.56 | |
| km_fnr_NADP | 0.22 | |
| kf_cyclic_electron_flow | 1 | |
| O2_dissolved_lumen | 8 | |
| kf_ndh | 0.004 | |
| kStt7 | 0.0035 | |
| kPph1 | 0.0013 | |
| km_lhc_state_transition_12 | 0.2 | |
| n_ST | 2 |
Derived quantities
| Symbol | ID | Equation |
|---|---|---|
| RT | ||
| dG_pH | ||
| pH_lumen | ||
| Plastoquinone_reduced | ||
| Plastocyanine_reduced | ||
| Ferredoxine_reduced | ||
| ADP | ||
| NADP | ||
| Light_minus_harvesting_complex_protonated | ||
| PSII_cross_section | ||
| keq_Plastoquinone_reduced | ||
| keq_atp_synthase | ||
| keq_b6f | ||
| keq_fnr | ||
| vmax_fnr | ||
| keq_PCP700 | ||
| keq_ferredoxin_reductase | ||
| A1 | ||
| B0 | ||
| B1 | ||
| B2 | ||
| B3 | ||
| PQ_red_div_tot | ||
| Fd_red_div_tot | ||
| PC_red_div_tot | ||
| NADPH_div_tot | ||
| ATP_div_tot | ||
| Fluo |
Reactions
| Symbol | ID | Rate | Stoichiometry |
|---|---|---|---|
| PSII | |||
| PSI | |||
| PTOX | |||
| ndh | |||
| b6f | |||
| cyclic_electron_flow | |||
| fnr | |||
| proton_leak | |||
| lhc_state_transition_12 | |||
| lhc_state_transition_21 | |||
| atp_synthase | |||
| atp_consumption | |||
| nadph_consumption |
The original model calculates the pH as log10(proton_concentration).
To avoid numerical instabilities, we clamped the pH to the range of 1-14 using log10(clamp(0.1, proton_concentration, 1e-14)).
Curation
- July 2026: Maintenance by Maja Blume
- June 2026: Initial implementation by Elouen Corvest
This model was validated by reproducing the following figures of the original publication.
Figures
Fig2
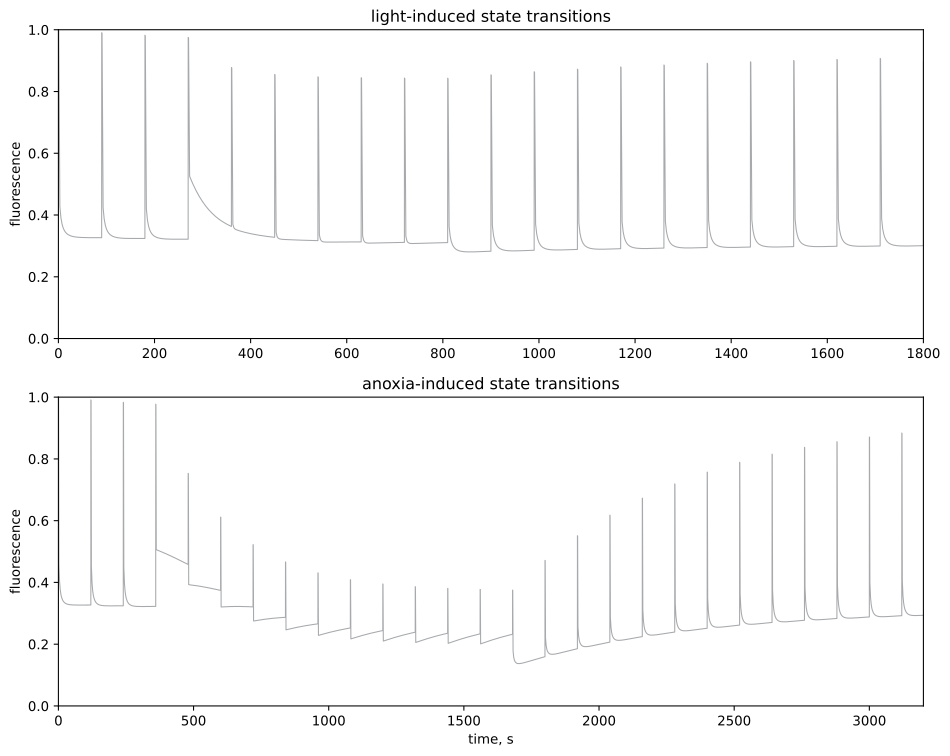
Fig3