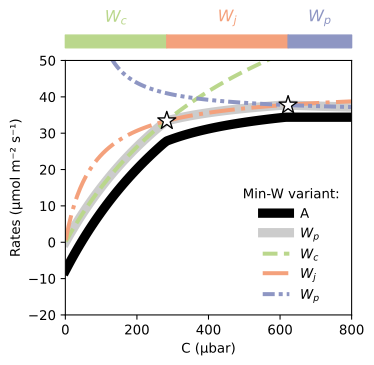
FvCB 1980, Plant Cell Environ.
The Farquhar, von Caemmerer, and Berry model is a widely used model to calculate steady-state carbon assimilation () rates in plants. It was first developed in 1980 and has since gained massive popularity and been modified and used in other models of plant photosynthesis. It can be argued that it is the most important model of photosynthesis, even if it is only built on algebraic functions. It uses the assumption that the carbon assimilation rate is dependent on only two, later three, rates. The RuBisCO limited rate (), the electron transport limited rate (), and the triphosphate limited rate ().
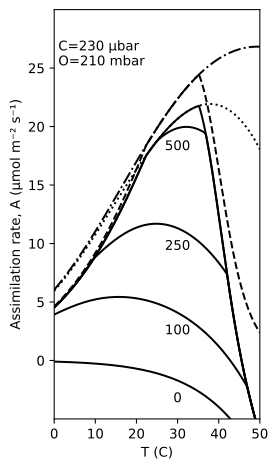
Since this model has seen widespread use, a variant that includes translation errors, the min-A variant, has emerged. This variant first calculates three distinct carbon assimilations, each including the three limiting rates separately. Afterward, it uses the minimum of the calculated limiting rates of carbon assimilation to calculate the final assimilation rate. However, the correct version, the min-W variant, uses the minimum of the limiting rates to replace the carboxylase rate () in the calculation of . While both variants showcase the same trend in higher partial pressure of , the min-A deviates from the original model in lower partial pressure (Lochocki et al. 2025). Therefore, it is recommended to use the min-W variant when showcasing the model from the original work.
Scheme

Analysis
Model definition
Parameters
| Symbol | ID | Value |
|---|---|---|
| Ci | 500 | |
| vcmax | 80 | |
| kc | 259 | |
| ko | 179 | |
| ccp | 38.6 | |
| rl | 1 | |
| alpha | 0 | |
| o | 210 | |
| j | 124 | |
| tp | 15 |
Derived quantities
| Symbol | ID | Equation |
|---|---|---|
| wc | ||
| wj | ||
| wp | ||
| vc | ||
| an |
Curation
- July 2026: Initial implementation by Elouen Corvest
- July 2026: Maintenance by Marvin van Aalst
This model was validated by reproducing the following figures of the original publication.
The figures from the original 1980 paper have been created, as well as one scheme from the Lochocki et al. paper. There are minimal discrepancies in some schemes that result in lines being shifted up or down. However, most are consistent; therefore, the validation is deemed successful.
Figures
Fig4
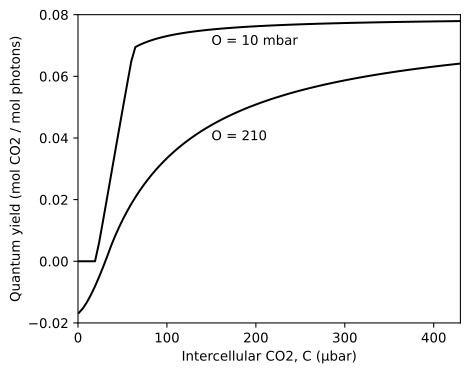
Fig5
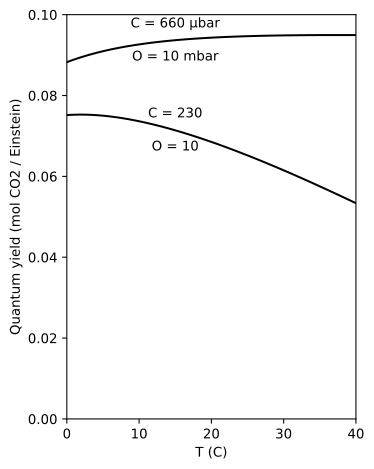
Fig6
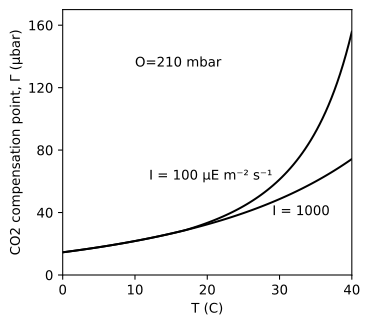
Fig7
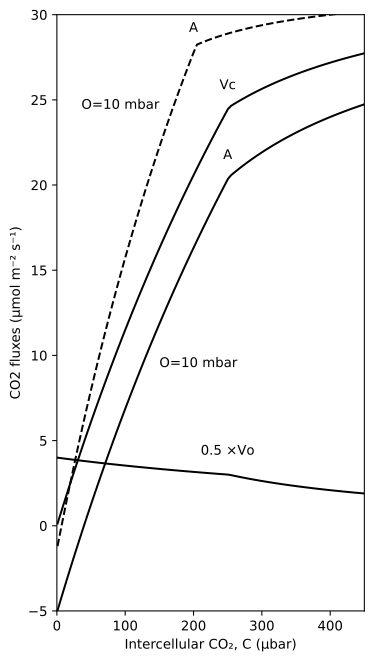
Fig8
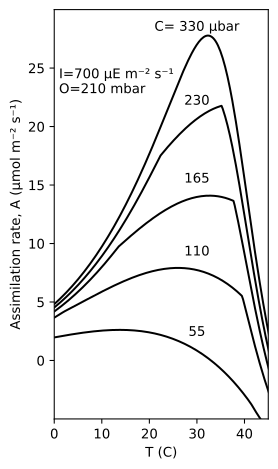
Fig9
FigX