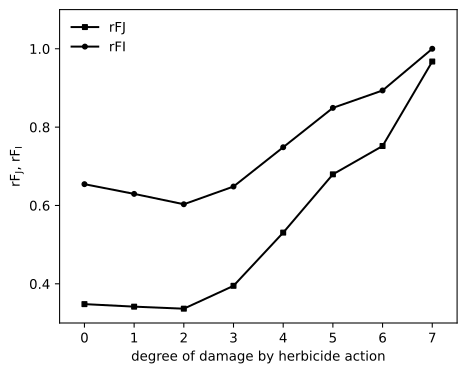
Lazar 1997, Pestic. Biochem. Physiol.
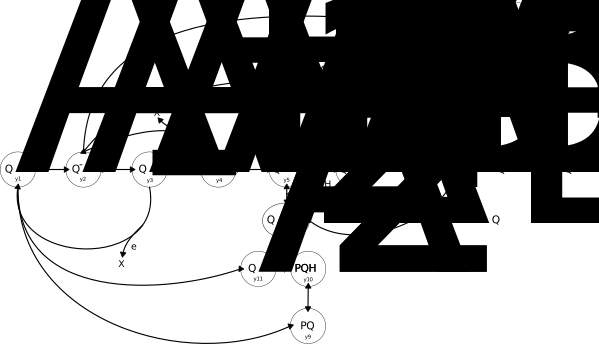
The Lazár 1997 model is a kinetic model of chlorophyll fluorescence induction, built to simulate the fast fluorescence rise of cereal leaves and to interpret how that signal changes under the action of herbicides. It describes electron transfer through photosystem II (PSII) to the plastoquinone (PQ) pool through a network of reaction-centre states, and the measurable fluorescence yield is derived from the redox states of those centres. To match real measurements, the model distinguishes three kinds of PSII centre — Q_B-reducing, Q_B-nonreducing, and inactive centres — which together shape the characteristic multi-phase fluorescence transient.
The authors used the model to reproduce fluorescence induction curves measured on barley and wheat leaves treated with triazine- and urea-type herbicides, which act by blocking electron transport at the Q_B site of PSII, and compared the parameters obtained by simulation with those extracted from the experimental curves. This makes the model an early example of using a mechanistic description of PSII to turn a simple, non-invasive fluorescence measurement into a quantitative probe of photosynthetic electron transport and herbicide action. Within GreenSloth it sits alongside the other PSII-focused models as a compact, classic treatment of fluorescence induction kinetics.
Scheme
Analysis
Model definition
Variables
| Symbol | ID | Initial value |
|---|---|---|
| y1 | 0.66 | |
| y2 | 0 | |
| y3 | 0 | |
| y4 | 0 | |
| y5 | 0 | |
| y6 | 0 | |
| y7 | 0 | |
| y8 | 0 | |
| y9 | 7 | |
| y10 | 0 | |
| y11 | 0 | |
| y12 | 0 | |
| y13 | 0.22 | |
| y14 | 0 | |
| y15 | 0.12 |
Parameters
| Symbol | ID | Value |
|---|---|---|
| k1 | 1666 | |
| k2 | 1250 | |
| k3 | 500 | |
| k4 | 20000 | |
| k5 | 1666 | |
| k6 | 3500 | |
| k7 | 175 | |
| k8 | 1750 | |
| k9 | 35 | |
| k10 | 5000 | |
| k11 | 5000 | |
| k12 | 150 | |
| k13 | 100 | |
| k14 | 150 | |
| k15 | 100 | |
| k16 | 150 | |
| k17 | 100 | |
| k18 | 150 | |
| k19 | 100 | |
| k20 | 150 | |
| k21 | 100 | |
| k22 | 150 | |
| k23 | 100 | |
| k24 | 1 | |
| k25 | 1 | |
| k6n | 3500 | |
| p | 0.55 |
Derived quantities
| Symbol | ID | Equation |
|---|---|---|
| eprime | ||
| F |
Reactions
| Symbol | ID | Rate | Stoichiometry |
|---|---|---|---|
| v1 | |||
| v2 | |||
| v3 | |||
| v4 | |||
| v5 | |||
| v6 | |||
| v7 | |||
| v8 | |||
| v9 | |||
| v10 | |||
| v11 | |||
| v12 | |||
| v13 | |||
| v14 | |||
| v15 |
Curation
- July 2026: Maintenance by Marvin van Aalst
- June 2026: Initial implementation by Tim Nies
This model was validated by reproducing the following figures of the original publication.
Figures
Fig2
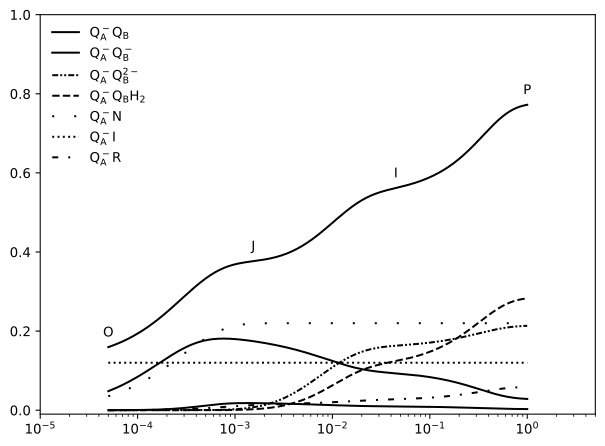
Fig5
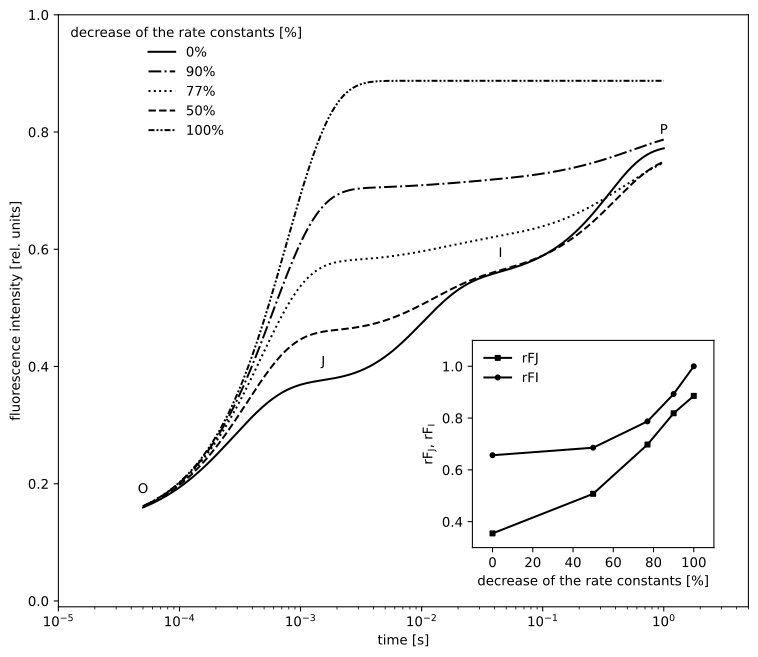
Fig6
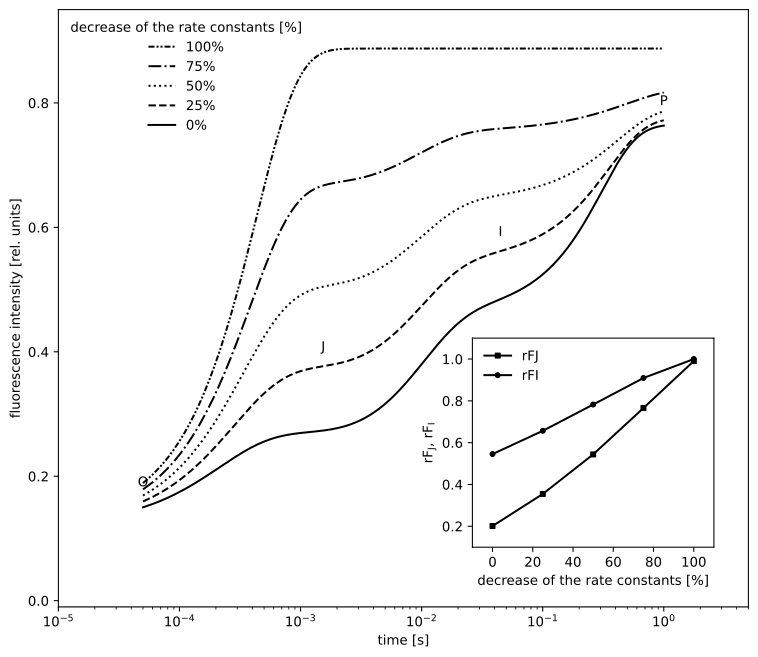
Fig7
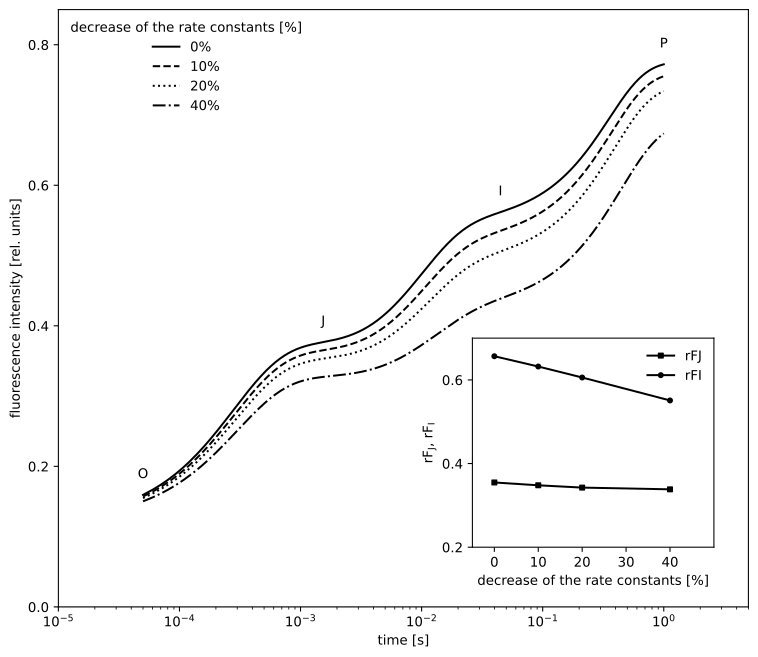
Fig8